Market Outlook
November 29, 2017
Market Cues
Domestic Indices
Chg (%)
(Pts)
(Close)
Indian markets are likely to open positive tracking global indices and SGX Nifty.
BSE Sensex
(0.3)
(106)
33,619
The US stocks saw some volatility in afternoon trading on Tuesday but the major
Nifty
(0.3)
(29)
10,370
averages climbed to new record closing highs. The Dow surged up 1.1 percent to
Mid Cap
0.1
17
17,039
23,837, the Nasdaq climbed 0.5 percent to 6,912 and the S&P 500 jumped 1
Small Cap
0.3
50
18,214
percent to 2,627.
Bankex
(0.2)
(73)
29,287
The U.K. shares rose on Tuesday after all seven biggest lenders in UK passed the
stress test for the first time since the test was launched in 2014. The benchmark FTSE
Global Indices
Chg (%)
(Pts)
(Close)
100 was up 1 percent at 7,461. The Bank of England said that the 2017 stress test
shows the U.K. banking system is resilient to deep simultaneous recessions in the
Dow Jones
1.1
256
23,837
U.K. and global economies, large falls in asset prices and a separate stress of
Nasdaq
0.5
34
6,912
misconduct costs.
FTSE
1.0
77
7,461
Nikkei
(0.0)
(10)
22,486
Indian shares fell slightly on Tuesday as investors took some profits following recent
sharp gains and awaited cues from September-quarter GDP data, due on Thursday.
Hang Seng
(0.0)
(5)
29,681
Mixed global cues also weighed on markets. BSE Sensex closed lower by 0.3%, at
Shanghai Com
0.3
11
3,334
33,619, while the Nifty 50 fell 0.3%, to close at 10,370.
Advances / Declines
BSE
NSE
News Analysis
Advances
1,389
857
USFDA issues 7 observations on Glenmark plant
Declines
1,356
895
Detailed analysis on Pg2
Unchanged
151
75
Investor’s Ready Reckoner
Key Domestic & Global Indicators
Volumes (` Cr)
Stock Watch: Latest investment recommendations on 150+ stocks
BSE
4,262
Refer Pg5 onwards
NSE
32,659
Top Picks
CMP
Target
Upside
Net Inflows (` Cr)
Net
Mtd
Ytd
Company
Sector
Rating
(`)
(`)
(%)
FII
108
16,617
55,069
Blue Star
Capital Goods
Buy
730
867
18.7
MFs
2,326
3,825
99,236
Dewan Housing Finance
Financials
Buy
617
712
15.5
Asian Granito
Other
Accumulate
504
570
13.2
Navkar Corporation
Other
Buy
185
265
43.0
Top Gainers
Price (`)
Chg (%)
KEI Industries
Capital Goods Accumulate
393
425
8.1
Naukri
1,301
7.8
More Top Picks on Pg4
Ncc
119
7.4
Key Upcoming Events
Mcleodruss
226
6.9
Previous
Consensus
Date
Region
Event Description
Piind
940
6.1
Reading
Expectations
Rallis
244
6.0
Nov29
Euro Zone Euro-Zone Consumer Confidence
0.10
0.10
Nov29
US
Initial Jobless claims
239.00
240.00
Nov30
US
GDP Qoq (Annualised)
3.00
3.20
Top Losers
Price (`)
Chg (%)
Nov30
Germany Unemployment change (000's)
(11.00)
(10.00)
Rnaval
41
(8.1)
Nov30
UK
PMI Manufacturing
56.30
56.50
Rtnpower
8
(5.5)
More Events on Pg7
Gmrinfra
18
(4.5)
Abfrl
166
(4.1)
Icil
122
(3.9)
As on November, 28 2017
Market Outlook
November 29, 2017
News Analysis
USFDA issues 7 observations on Glenmark plant
The USFDA has issued 7 observations in a Form 483 issued to Glenmark’s Baddi
unit which underwent inspection between 6-11 November. The company has
indicated that it is in the midst of providing a comprehensive response to the
observations. The firm makes dermatology products including ointment and
contributes from this unit. Which accounts for 10% of Glenmark’s US sales. Which
works out to be about 4% of its total consolidated sales.
The observations made by US FDA for the Baddi unit are 1) No thorough review of
unexplained discrepancy in drug batches 2) lack of written procedures to assure
identity and strength of products 3) deficient complaint records 4) inadequate
maintenance of records to evaluate quality standards of each drug 5) insufficient
adherence to responsibilities and procedures of the quality control unit
6)
inappropriate controls over computers or related systems and 7) lack of proper
training to employees for the functions they need to perform. There is no data
integration observations in the Form 483. We believe that the stock will remain
under pressure in the coming days.
Economic and Political News
Income tax notices to 1.16 lakh for cash deposit of over `25 lakh post
demonetisation
China Development Bank files insolvency case against RCom
States meet GST target as Centre plugs shortfall
Singapore's DBS Bank lowers India's FY18 GDP growth to 6.6 per cent
Economic Growth Set To End 5-Quarter Slide, Say Economists
Bitcoin at all-time high, tops $10,000 in some exchanges
Corporate News
Trai backs Net Neutrality, Reliance Jio, Airtel stand to gain
Drug regulator to make ‘stability testing’ a must for all medicines
GMR Airports IPO likely by June 2018
L&T may sell some assets by March to fund acquisition spree
Maggi fails lab test again, UP imposes Rs 45 lakh fine on Nestle India
Market Outlook
November 29, 2017
Top Picks HHHHH
Market Cap
CMP
Target
Upside
Company
Rationale
(` Cr)
(`)
(`)
(%)
Strong growth in domestic business due to its leade`hip
in acute therapeutic segment. Alkem expects to launch
Alkem Laboratories
23,527
1,968
2,125
8.0
more products in USA, which bodes for its international
business.
We expect the company would report strong profitability
Asian Granito
1,515
504
570
13.2
owing to better product mix, higher B2C sales and
amalgamation synergy.
Favorable outlook for the AC industry to augur well for
Cooling products business which is out pacing the
Blue Star
7,000
730
867
18.7
market growth. EMPPAC division's profitability to
improve once operating environment turns around.
With a focus on the low and medium income (LMI)
consumer segment, the company has increased its
Dewan Housing Finance
19,337
617
712
15.5
presence in tier-II & III cities where the growth
opportunity is immense.
Loan growth is likely to pick up after a sluggish FY17.
Lower credit cost will help in strong bottom-line growth.
Karur Vysya Bank
7,134
118
180
52.5
Increasing share of CASA will help in NIM
improvement.
High order book execution in EPC segment, rising B2C
KEI Industries
3,082
393
425
8.1
sales and higher exports to boost the revenues and
profitability
Expected to benefit from the lower capex requirement
Music Broadcast
2,132
374
434
16.2
and 15 year long radio broadcast licensing.
Massive capacity expansion along with rail advantage
Navkar Corporation
2,788
185
265
43.0
at ICD as well CFS augur well for the company
Strong brands and distribution network would boost
Siyaram Silk Mills
3,010
642
680
5.9
growth going ahead. Stock currently trades at an
inexpensive valuation.
Market leadership in Hindi news genre and no.
2
viewership ranking in English news genre, exit from the
TV Today Network
2,332
391
435
11.3
radio business, and anticipated growth in ad spends by
corporate to benefit the stock.
After GST, the company is expected to see higher
volumes along with improving product mix. The Gujarat
Maruti Suzuki
2,60,580
8,626
9,489
10.0
plant will also enable higher operating leverage which
will be margin accretive.
We expect loan book to grow at 24.3% over next two
GIC Housing
2,469
459
655
42.8
year; change in borrowing mix will help in NIM
improvement
We expect CPIL to report net Revenue/PAT CAGR of
~17%/16% over FY2017-20E mainly due to healthy
7,022
316
399
26
growth in plywood & lamination business, forayed into
Century Plyboards India
MDF & Particle boards on back of strong brand &
distribution network.
We expect sales/PAT to grow at 13.5%/20% over next
LT Foods
1875
70
96
37
two years on the back of strong distribution network &
addition of new products in portfolio.
Source: Company, Angel Research
Market Outlook
November 29, 2017
Key Upcoming Events
Result Calendar
Date
Company
November 14, 2017
Tata Global, JK Tyre, CEAT, Jyoti Structures, Bank of Baroda, Reliance Capital, Corporation Bank, MOIL
November 15, 2017
Automotive Axle
Source: Bloomberg, Angel Research
Global economic events release calendar
Bloomberg Data
Date
Time
Country
Event Description
Unit
Period
Last Reported
Estimated
Nov 29, 2017
3:30 PMEuro Zone Euro-Zone Consumer Confidence
Value
Nov F
0.10
0.10
7:00 PMUS
Initial Jobless claims
Thousands
Nov 25
239.00
240.00
Nov 30, 2017
7:00 PMUS
GDP Qoq (Annualised)
% Change
3Q S
3.00
3.20
2:25 PMGermany Unemployment change (000's)
Thousands
Nov
(11.00)
(10.00)
3:00 PMUK
PMI Manufacturing
Value
Nov
56.30
56.50
Dec 01, 2017
6:30 AMChina
PMI Manufacturing
Value
Nov
51.60
51.50
2:25 PMGermany PMI Manufacturing
Value
Nov F
62.50
62.50
Dec 05, 2017
2:25 PMGermany PMI Services
Value
Nov F
54.90
3:30 PMEuro Zone Euro-Zone GDP s.a. (QoQ)
% Change
3Q F
0.60
Dec 06, 2017
2:30 PMIndia
RBI Reverse Repo rate
%
Dec 6
5.75
5.75
2:30 PMIndia
RBI Repo rate
%
Dec 6
6.00
6.00
2:30 PMIndia
RBI Cash Reserve ratio
%
Dec 6
4.00
4.00
Dec 08, 2017
3:00 PMUK
Industrial Production (YoY)
% Change
Oct
2.50
India
Imports YoY%
% Change
Nov
7.60
India
Exports YoY%
% Change
Nov
(1.10)
Source: Bloomberg, Angel Research
Market Outlook
November 29, 2017
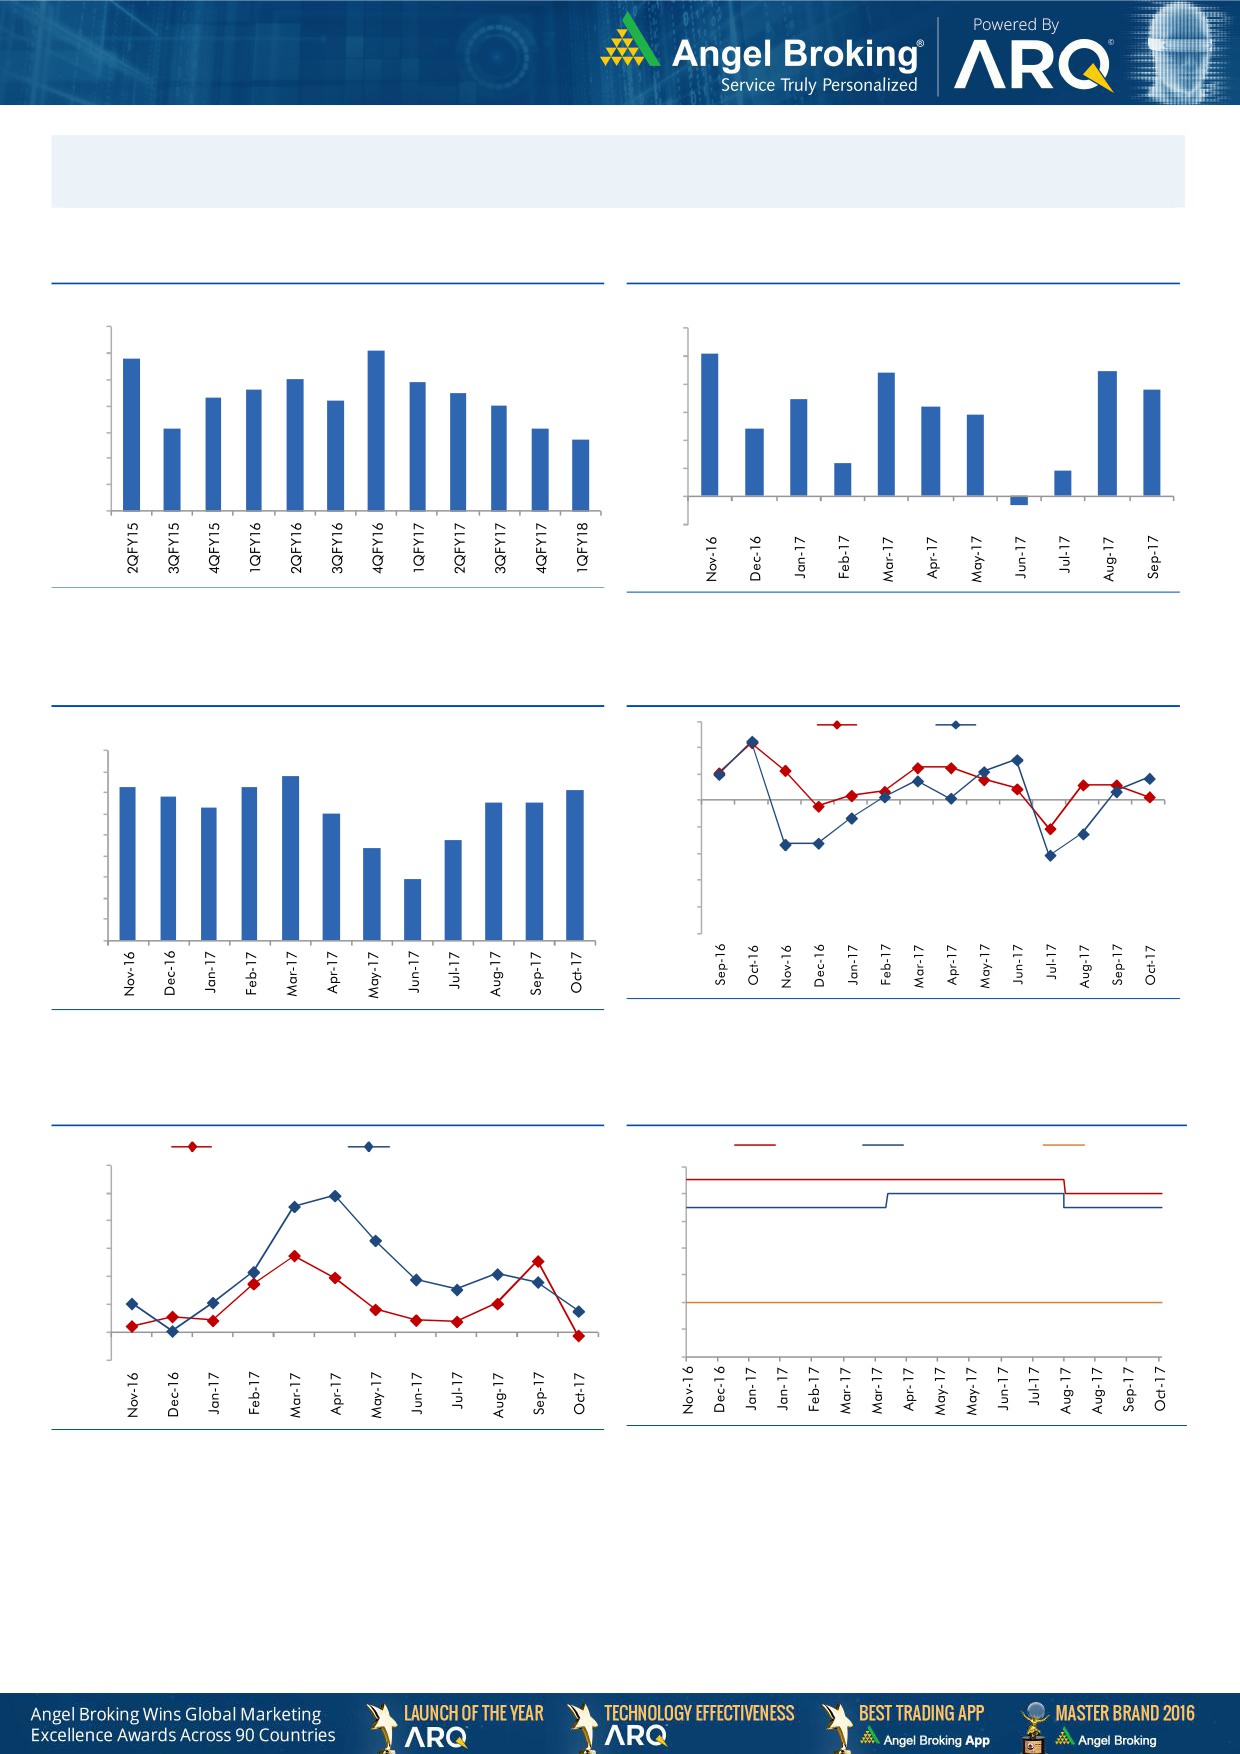
Macro watch
Exhibit 1: Quarterly GDP trends
Exhibit 2: IIP trends
(%)
(%)
10.0
6.0
9.1
5.1
8.8
9.0
5.0
4.4
4.5
8.0
7.9
7.6
7.5
3.8
8.0
7.3
3.5
7.2
7.0
4.0
3.2
2.9
7.0
6.1
6.1
3.0
2.4
5.7
6.0
2.0
1.2
5.0
0.9
1.0
4.0
-
3.0
(1.0)
(0.3)
Source: CSO, Angel Research
Source: MOSPI, Angel Research
Exhibit 3: Monthly CPI inflation trends
Exhibit 4: Manufacturing and services PMI
56.0
Mfg. PMI
Services PMI
(%)
4.5
54.0
3.9
4.0
3.6
3.7
3.6
52.0
3.4
3.2
3.3
3.3
3.5
3.0
50.0
3.0
2.4
48.0
2.5
2.2
2.0
46.0
1.5
1.5
44.0
1.0
42.0
0.5
40.0
-
Source: Market, Angel Research; Note: Level above 50 indicates expansion
Source: MOSPI, Angel Research
Exhibit 5: Exports and imports growth trends
Exhibit 6: Key policy rates
(%)
Exports yoy growth
Imports yoy growth
(%)
Repo rate
Reverse Repo rate
CRR
60.0
6.50
50.0
6.00
40.0
5.50
30.0
5.00
20.0
4.50
10.0
4.00
0.0
3.50
(10.0)
3.00
Source: Bloomberg, Angel Research
Source: RBI, Angel Research
Market Outlook
November 29, 2017
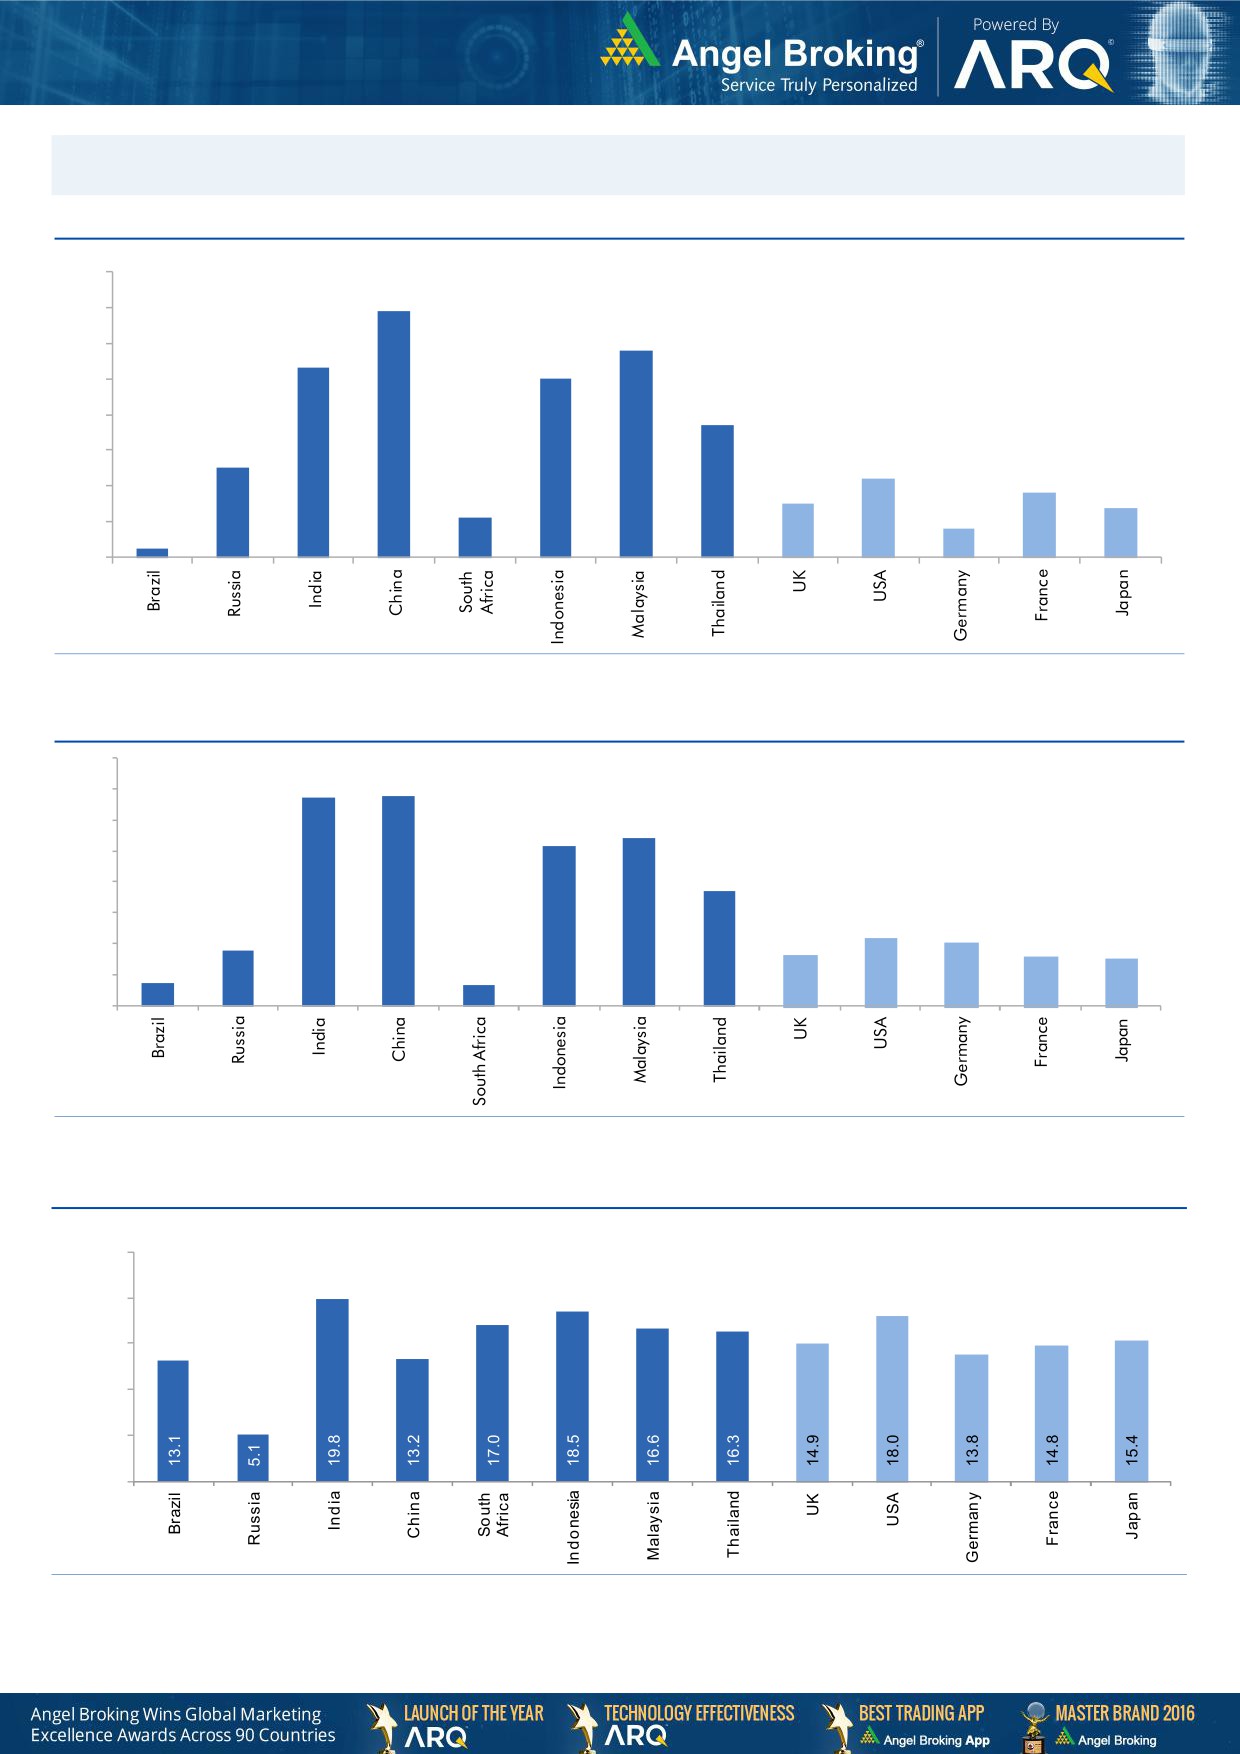
Global watch
Exhibit 1: Latest quarterly GDP Growth (%, yoy) across select developing and developed countries
(%)
8.0
6.9
7.0
5.8
6.0
5.3
5.0
5.0
1.1
3.7
4.0
2.5
3.0
2.2
1.8
2.0
1.5
1.4
0.8
1.0
0.3
-
Source: Bloomberg, Angel Research
Exhibit 2: 2017 GDP Growth projection by IMF (%, yoy) across select developing and developed countries
(%)
6.7
6.8
7.0
6.0
5.4
5.2
5.0
3.7
4.0
3.0
1.8
2.2
2.0
1.7
1.6
2.0
0.7
1.5
0.7
1.0
-
Source: IMF, Angel Research
Exhibit 3: One year forward P-E ratio across select developing and developed countries
(x)
25.0
20.0
15.0
10.0
5.0
-
Source: IMF, Angel Research
Market Outlook
November 29, 2017
Exhibit 4: Relative performance of indices across globe
Returns (%)
Country
Name of index
Closing price
1M
3M
1YR
Brazil
Bovespa
74,140
(1.8)
5.8
19.5
Russia
Micex
2,149
4.0
7.0
1.1
India
Nifty
10,370
0.5
4.6
27.8
China
Shanghai Composite
3,334
(2.4)
1.4
4.4
South Africa
Top 40
53,645
2.7
7.9
22.1
Mexico
Mexbol
47,229
(5.7)
(8.0)
4.2
Indonesia
LQ45
1,025
4.0
4.0
16.7
Malaysia
KLCI
1,714
(1.8)
(3.3)
5.6
Thailand
SET 50
1,091
0.0
8.8
19.0
USA
Dow Jones
23,837
1.1
8.1
23.5
UK
FTSE
7,461
(0.6)
1.3
10.0
Japan
Nikkei
22,486
3.6
16.2
24.2
Germany
DAX
13,060
(0.7)
7.6
23.8
France
CAC
5,390
(1.9)
6.6
16.3
Source: Bloomberg, Angel Research p68in4
Stock Watch
November 29, 2017
Company Name
Reco
CMP
Target
Mkt Cap
Sales ( Čcr )
OPM(%)
EPS (Č)
PER(x)
P/BV(x)
RoE(%)
EV/Sales(x)
(Č)
Price ( Č)
( Č cr )
FY18E FY19E
FY18E
FY19E
FY18E
FY19E
FY18E
FY19E
FY18E
FY19E
FY18E
FY19E
FY18E
FY19E
Agri / Agri Chemical
Rallis
Reduce
244
209
4,747
1,873
2,099
15.0
15.0
9.5
10.5
25.7
23.3
3.9
3.5
15.8
16.0
2.4
2.2
United Phosphorus
Accumulate
762
820
38,749
18,922
21,949
18.0
18.5
36.2
45.6
21.1
16.7
4.4
3.6
22.7
23.8
2.2
1.8
Auto & Auto Ancillary
Ashok Leyland
Neutral
122
-
35,564
23,339
27,240
10.1
10.8
4.7
6.2
26.1
19.5
5.2
4.6
20.0
23.6
1.5
1.2
Bajaj Auto
Neutral
3,293
-
95,277
23,936
27,955
19.5
20.1
142.7
167.3
23.1
19.7
5.0
4.5
21.8
22.8
3.6
3.0
Bharat Forge
Buy
697
875
32,456
7,637
8,755
21.7
23.2
36.1
47.3
19.3
14.8
3.5
3.0
18.5
20.8
4.1
3.5
Eicher Motors
Neutral
30,537
-
83,128
19,043
22,837
19.5
19.9
835.4
1,019.0
36.6
30.0
13.7
10.5
40.9
37.8
4.2
3.5
Gabriel India
Neutral
188
-
2,695
1,782
2,033
9.7
10.2
7.1
8.9
26.4
21.2
5.3
4.5
21.0
22.2
1.5
1.3
Hero Motocorp
Accumulate
3,674
4,129
73,369
32,239
36,878
16.0
15.6
184.4
206.5
19.9
17.8
6.3
5.5
31.3
30.7
2.1
1.8
Jamna Auto Industries Neutral
63
-
2,520
1,441
1,662
14.4
14.8
13.9
17.6
4.6
3.6
1.2
1.0
30.0
31.0
1.7
1.5
Mahindra and Mahindra Neutral
1,435
-
89,202
46,971
53,816
13.6
14.0
67.7
79.8
21.2
18.0
3.0
2.7
15.0
15.9
1.8
1.5
Maruti
Accumulate
8,626
9,489
260,580
79,470
95,208
15.9
17.2
281.7
363.8
30.6
23.7
6.7
5.4
21.7
22.8
2.9
2.4
Minda Industries
Neutral
1,196
-
10,337
4,328
5,084
11.0
11.9
27.3
36.4
43.9
32.9
9.3
7.3
23.1
25.6
2.5
2.1
Motherson Sumi
Neutral
361
-
76,018
55,937
64,445
10.8
11.4
16.9
21.1
21.4
17.2
4.8
4.9
25.2
25.4
1.4
1.2
Tata Motors
Neutral
416
-
120,099
303,167
343,649
11.8
13.8
33.1
54.7
12.6
7.6
2.1
1.6
16.9
23.0
0.4
0.4
TVS Motor
Neutral
743
-
35,304
13,992
16,216
9.0
9.4
17.1
20.3
43.6
36.6
11.6
9.0
29.7
27.7
2.5
2.1
Amara Raja Batteries
Accumulate
800
858
13,671
6,140
7,122
14.3
15.6
29.3
39.0
27.3
20.5
4.7
3.9
17.1
19.0
2.2
1.9
Exide Industries
Neutral
207
-
17,599
8,689
9,854
15.1
15.2
9.7
11.0
21.5
18.8
3.8
3.4
15.7
16.1
1.8
1.5
Apollo Tyres
Neutral
257
-
14,687
15,739
17,326
13.3
14.6
20.4
26.7
12.6
9.6
1.5
1.3
20.4
26.7
1.2
1.0
Ceat
Neutral
1,835
-
7,424
6,661
7,717
11.1
14.2
116.2
178.2
15.8
10.3
2.7
2.3
15.2
21.3
1.2
1.1
JK Tyres
Neutral
147
-
3,323
8,318
9,239
16.2
16.4
21.0
27.5
7.0
5.3
1.4
1.1
19.1
20.4
0.8
0.7
Swaraj Engines
Neutral
1,999
-
2,484
788
889
16.4
16.5
71.6
81.0
27.9
24.7
8.1
7.5
29.6
31.0
2.8
2.4
Subros
Neutral
269
-
1,615
1,855
2,135
11.6
11.8
10.3
14.7
26.3
18.4
4.0
3.4
15.8
19.1
1.1
0.9
Capital Goods
BEML
Neutral
1,694
-
7,054
4,286
5,194
7.1
8.2
42.9
58.1
39.5
29.2
3.2
2.9
7.6
8.7
1.7
1.4
Bharat Electronics
Neutral
187
-
45,835
10,258
12,470
19.6
19.5
7.3
8.6
25.6
21.7
0.5
0.4
20.4
21.9
4.0
3.2
Voltas
Neutral
637
-
21,072
6,778
8,004
9.6
11.0
17.1
22.4
37.2
28.4
8.9
7.8
17.7
19.8
2.8
2.4
BHEL
Neutral
94
-
34,566
33,200
39,167
6.8
9.5
6.2
11.2
15.2
8.4
0.7
0.7
4.6
8.0
0.6
0.5
Blue Star
Buy
730
867
7,000
5,220
6,207
6.3
6.6
16.8
22.3
43.5
32.8
8.6
7.6
19.9
23.3
1.3
1.1
CG Power and Industrial
Neutral
88
-
5,522
6,555
7,292
7.5
7.5
-
0.8
8,810.0
110.1
1.4
1.4
0.1
1.2
0.9
0.8
Solutions
Greaves Cotton
Neutral
120
-
2,940
1,778
1,993
14.7
15.1
8.1
9.1
14.9
13.2
3.3
3.1
21.8
23.6
1.4
1.3
Stock Watch
November 29, 2017
Company Name
Reco
CMP
Target
Mkt Cap
Sales ( Čcr )
OPM(%)
EPS (Č)
PER(x)
P/BV(x)
RoE(%)
EV/Sales(x)
(Č)
Price ( Č)
( Č cr )
FY18E FY19E
FY18E
FY19E
FY18E
FY19E
FY18E
FY19E
FY18E
FY19E
FY18E
FY19E
FY18E
FY19E
Capital Goods
KEC International
Accumulate
326
350
8,372
9,779
11,113
9.4
9.8
14.2
18.2
22.9
17.9
4.4
3.6
21.1
22.1
1.1
1.0
KEI Industries
Accumulate
393
425
3,082
3,001
3,391
10.0
10.0
13.0
16.1
30.2
24.4
5.5
4.6
18.2
18.7
1.2
1.1
Thermax
Neutral
1,068
-
12,725
4,125
4,747
10.3
10.8
26.7
31.5
40.0
33.9
4.5
4.1
11.2
12.0
2.8
2.4
VATech Wabag
Accumulate
599
681
3,273
3,867
4,126
9.6
10.0
34.9
39.8
17.2
15.1
2.8
2.5
17.7
17.5
0.9
0.8
Cement
ACC
Neutral
1,684
-
31,614
12,255
13,350
13.5
14.3
58.0
66.2
29.0
25.4
3.4
3.2
11.5
12.2
2.6
2.3
Ambuja Cements
Neutral
263
-
52,292
10,250
11,450
17.5
19.0
7.2
8.3
36.6
31.7
2.6
2.5
7.0
7.8
4.9
4.3
India Cements
Neutral
177
-
5,448
6,135
6,750
14.8
15.2
8.5
11.5
20.8
15.4
1.0
1.0
4.8
6.2
1.2
1.1
JK Cement
Neutral
994
-
6,949
4,150
4,775
19.2
20.0
49.0
63.5
20.3
15.7
3.2
2.8
17.0
18.5
2.1
1.8
J K Lakshmi Cement
Neutral
409
-
4,807
3,422
3,757
15.5
17.0
13.5
23.2
30.3
17.6
3.1
2.7
10.8
15.5
1.8
1.6
Orient Cement
Neutral
163
-
3,339
2,215
3,233
16.8
17.0
5.9
6.9
27.6
23.6
2.1
2.0
10.8
10.1
2.5
1.7
UltraTech Cement
Neutral
4,258
-
116,902
28,250
35,150
20.2
23.5
77.5
122.2
54.9
34.8
4.6
4.2
9.6
14.8
4.6
3.7
Construction
KNR Constructions
Neutral
280
-
3,935
1,846
2,203
14.5
14.5
12.1
13.7
23.1
20.5
1.3
1.1
17.5
16.7
2.2
1.8
Larsen & Toubro
Neutral
1,212
-
169,847
95,787
109,476
10.2
11.6
44.5
50.8
27.3
23.9
3.4
3.1
12.9
13.1
2.3
2.1
Gujarat Pipavav Port
Neutral
148
-
7,138
739
842
61.6
62.7
5.1
6.2
29.0
24.0
3.6
3.5
12.7
14.9
9.1
7.9
PNC Infratech
Neutral
192
-
4,924
2,040
2,935
13.0
13.0
6.4
9.0
30.0
21.3
0.8
0.7
9.7
12.2
2.4
1.7
Simplex Infra
Neutral
572
-
2,830
6,012
6,619
11.6
11.7
21.1
31.0
27.2
18.5
1.9
1.7
6.5
8.6
1.0
0.9
Sadbhav Engineering
Neutral
377
-
6,472
3,823
4,426
10.7
10.8
10.3
11.8
36.6
32.0
4.4
3.9
10.1
10.5
2.0
1.8
NBCC
Neutral
263
-
23,630
9,099
12,706
6.4
6.4
7.3
9.6
36.1
27.5
1.6
1.3
27.5
30.5
2.5
1.8
MEP Infra
Neutral
100
-
1,631
2,403
2,910
18.3
16.8
2.4
6.1
42.7
16.5
16.2
10.9
35.2
55.8
1.8
1.5
SIPL
Neutral
138
-
4,843
2,060
2,390
46.8
47.7
(5.8)
(3.1)
5.2
5.9
(14.2)
(2.3)
7.1
6.6
Engineers India
Neutral
183
-
12,298
1,795
2,611
21.1
22.4
5.9
8.1
30.9
22.5
2.2
2.1
12.9
16.1
5.2
3.4
Financials
Axis Bank
Neutral
562
-
134,833
32,558
35,843
3.5
3.2
27.8
41.0
20.2
13.7
2.2
1.9
11.4
14.9
-
-
Bank of Baroda
Neutral
172
-
39,678
22,533
26,079
2.4
2.4
12.0
20.9
14.3
8.2
0.9
0.9
6.6
11.0
-
-
Canara Bank
Neutral
385
-
22,996
17,925
20,235
2.0
2.1
18.5
36.5
20.8
10.6
0.8
0.7
3.4
6.2
-
-
Can Fin Homes
Neutral
484
-
6,435
586
741
3.5
3.5
107.8
141.0
4.5
3.4
1.0
0.8
24.1
25.6
-
-
Cholamandalam Inv. &
Neutral
1,280
-
20,009
2,826
3,307
6.3
6.3
53.7
64.6
23.9
19.8
4.1
3.5
18.3
18.9
-
-
Fin. Co.
Dewan Housing Finance Buy
617
712
19,337
2,676
3,383
2.4
2.7
37.4
49.7
16.5
12.4
2.2
1.9
13.8
16.2
-
-
Equitas Holdings
Buy
149
235
5,067
1,125
1,380
9.6
9.8
1.5
6.0
99.5
24.9
2.3
2.1
2.4
8.2
-
-
Federal Bank
Accumulate
113
125
22,202
4,896
5,930
2.8
3.1
5.4
7.6
21.1
14.9
1.8
1.6
8.5
11.0
-
-
Stock Watch
November 29, 2017
Company Name
Reco
CMP
Target
Mkt Cap
Sales ( Čcr )
OPM(%)
EPS (Č)
PER(x)
P/BV(x)
RoE(%)
EV/Sales(x)
(Č)
Price ( Č)
( Č cr )
FY18E FY19E
FY18E
FY19E
FY18E
FY19E
FY18E
FY19E
FY18E
FY19E
FY18E
FY19E
FY18E
FY19E
Financials
GIC Housing
Buy
459
655
2,469
376
477
3.6
3.7
33.0
40.0
13.9
11.5
2.5
2.1
20.0
23.0
-
-
HDFC Bank
Neutral
1,863
-
481,769
55,236
63,253
4.5
4.4
68.9
82.4
27.1
22.6
4.7
3.9
18.7
18.5
-
-
ICICI Bank
Neutral
314
-
201,444
42,361
51,378
3.6
3.9
18.4
25.7
17.1
12.2
1.9
1.8
11.3
15.0
-
-
Karur Vysya Bank
Buy
118
180
7,134
3,289
3,630
3.7
3.9
10.8
14.1
10.9
8.4
1.3
1.2
12.5
14.7
-
-
LIC Housing Finance
Accumulate
597
630
30,144
4,895
6,332
3.4
3.7
50.7
66.8
11.8
8.9
2.4
1.9
21.7
23.8
-
-
Punjab Natl.Bank
Neutral
184
-
39,123
23,708
25,758
2.1
2.1
5.9
16.4
31.3
11.2
0.9
0.9
3.0
8.3
-
-
RBL Bank
Neutral
521
-
21,712
2,309
2,888
2.6
2.5
16.4
19.1
31.9
27.3
4.0
3.6
13.3
13.8
-
-
Repco Home Finance
Buy
634
825
3,966
496
597
4.4
4.2
38.5
48.7
16.5
13.0
3.0
2.5
19.6
20.6
-
-
South Ind.Bank
Neutral
31
-
5,679
3,195
3,567
3.0
3.1
3.0
3.8
10.4
8.2
1.0
0.9
10.5
11.9
-
-
St Bk of India
Neutral
333
-
287,145
105,827
121,056
2.4
2.5
16.1
25.6
20.7
13.0
1.6
1.5
6.6
9.9
-
-
Union Bank
Neutral
165
-
12,004
14,650
16,225
2.3
2.3
23.1
32.5
7.2
5.1
0.5
0.5
7.1
9.2
-
-
Yes Bank
Neutral
315
-
72,421
11,088
13,138
3.0
2.9
84.0
99.3
3.8
3.2
0.6
0.5
16.3
16.8
-
-
FMCG
Akzo Nobel India
Neutral
1,790
-
8,584
3,164
3,607
13.8
13.7
58.6
67.9
30.6
26.3
7.5
6.6
24.5
25.1
2.6
2.2
Asian Paints
Neutral
1,170
-
112,221
17,603
20,615
18.6
18.6
2,128.9
2,543.3
0.6
0.5
11.6
9.8
28.0
28.9
6.2
5.2
Britannia
Neutral
4,794
-
57,552
9,690
11,278
14.8
15.4
84.0
101.0
57.1
47.5
20.8
16.5
40.6
39.0
5.9
5.1
Colgate
Neutral
1,053
-
28,639
4,420
5,074
24.9
25.3
28.6
32.8
36.8
32.1
14.5
11.7
43.8
40.5
6.2
5.4
Dabur India
Neutral
344
-
60,543
8,346
9,344
19.6
19.9
7.8
9.0
44.1
38.2
8.9
8.0
25.2
24.8
6.9
6.0
GlaxoSmith Con*
Neutral
6,096
-
25,636
5,072
5,760
18.2
18.4
176.3
199.2
34.6
30.6
7.3
6.6
21.2
21.7
4.4
3.8
Godrej Consumer
Neutral
981
-
66,818
10,171
11,682
20.8
21.5
21.7
27.1
45.2
36.2
10.2
8.7
22.3
23.4
6.7
5.8
HUL
Neutral
1,268
-
274,423
37,077
41,508
20.3
21.8
5,189.9
6,318.5
0.2
0.2
38.7
33.0
74.8
82.0
7.3
6.5
ITC
Neutral
257
-
313,107
44,588
49,853
37.0
37.3
9.6
11.0
26.8
23.4
6.6
6.3
25.1
27.3
6.5
5.8
Marico
Neutral
310
-
40,053
6,788
7,766
18.5
19.2
7.1
8.5
43.7
36.5
15.3
13.1
36.9
38.0
5.7
5.0
Nestle*
Neutral
7,496
-
72,278
10,083
11,182
20.0
20.9
119.7
141.3
62.6
53.1
220.7
201.7
36.7
39.8
6.8
6.1
Tata Global
Neutral
288
-
18,161
7,121
7,641
11.9
12.3
6.9
8.0
41.7
36.0
2.8
2.7
6.8
7.2
2.4
2.2
Procter & Gamble
Neutral
9,272
-
30,098
3,034
3,579
27.1
27.7
167.7
198.8
55.3
46.6
14.8
12.8
28.8
29.5
9.3
7.8
Hygiene
IT
HCL Tech^
Buy
859
1,014
122,585
50,009
54,608
22.1
22.1
62.8
67.6
13.7
12.7
3.1
2.6
22.4
20.6
2.1
1.8
Infosys
Accumulate
985
1,120
226,139
70,333
75,960
26.0
26.0
61.7
65.9
16.0
14.9
3.0
2.8
18.9
18.7
2.6
2.4
TCS
Reduce
2,685
2,442
513,967
123,384
134,488
26.1
26.1
133.2
143.7
20.2
18.7
5.6
5.2
27.6
27.8
3.8
3.5
Tech Mahindra
Accumulate
498
526
48,636
30,545
32,988
15.0
15.0
35.2
37.6
14.2
13.3
2.4
2.2
16.8
16.2
1.4
1.2
Stock Watch
November 29, 2017
Company Name
Reco
CMP
Target
Mkt Cap
Sales ( Čcr )
OPM(%)
EPS (Č)
PER(x)
P/BV(x)
RoE(%)
EV/Sales(x)
(Č)
Price ( Č)
( Č cr )
FY18E FY19E
FY18E
FY19E
FY18E
FY19E
FY18E
FY19E
FY18E
FY19E
FY18E
FY19E
FY18E
FY19E
IT
Wipro
Neutral
294
-
143,081
54,164
56,544
22.3
22.3
18.8
19.5
15.6
15.1
2.5
2.2
15.0
13.6
1.9
1.6
Media
D B Corp
Neutral
361
-
6,642
2,404
2,625
30.5
31.5
23.7
26.9
15.2
13.4
3.6
3.1
23.5
22.8
2.6
2.4
HT Media
Neutral
101
-
2,351
2,589
2,830
15.1
15.4
8.3
10.9
12.2
9.3
1.0
0.9
8.4
10.4
0.5
0.3
Jagran Prakashan
Buy
163
225
5,074
2,541
2,835
28.5
28.7
12.7
14.1
12.8
11.6
2.7
2.3
21.3
21.4
1.9
1.6
Sun TV Network
Neutral
886
-
34,930
3,238
3,789
51.9
55.1
30.9
38.0
28.7
23.3
8.2
7.2
30.0
31.0
10.3
8.7
Hindustan Media
Neutral
248
-
1,818
1,002
1,074
23.3
23.5
29.2
33.8
8.5
7.3
1.3
1.1
15.6
15.4
0.8
0.6
Ventures
TV Today Network
Accumulate
391
435
2,332
667
727
27.7
27.7
18.6
20.1
21.0
19.5
3.3
3.3
15.6
17.3
3.0
2.8
Music Broadcast Limited Buy
374
434
2,132
271
317
91.0
109.0
6.0
10.0
62.3
37.4
3.9
3.5
6.5
9.3
7.5
6.1
Metals & Mining
Coal India
Neutral
275
-
170,486
82,301
91,235
17.0
18.0
17.1
20.5
16.1
13.4
3.0
2.8
45.0
55.0
1.7
1.6
Hind. Zinc
Neutral
303
-
128,027
22,108
24,555
57.0
58.0
22.1
26.3
13.7
11.5
4.4
3.6
32.0
35.0
4.8
4.0
Hindalco
Neutral
251
-
56,288
102,350
105,355
13.5
14.5
21.5
24.5
11.7
10.2
1.6
1.4
15.0
15.2
1.1
1.1
JSW Steel
Neutral
256
-
61,953
64,500
68,245
21.1
21.5
20.1
21.2
12.8
12.1
2.3
2.0
-
-
1.7
1.6
NMDC
Neutral
127
-
40,023
10,209
11,450
47.0
48.0
11.1
12.1
11.4
10.5
1.6
1.5
-
-
3.4
3.1
SAIL
Neutral
81
-
33,412
54,100
63,555
3.0
10.0
(10.0)
1.5
53.9
1.1
1.1
-
-
1.6
1.4
Vedanta
Neutral
303
-
112,557
81,206
87,345
28.0
29.0
26.5
33.5
11.4
9.0
2.6
2.2
-
-
2.1
1.8
Tata Steel
Neutral
704
-
68,398
121,445
126,500
16.2
17.2
65.4
81.3
10.8
8.7
1.7
1.5
-
-
1.1
1.0
Oil & Gas
GAIL
Neutral
462
-
78,197
53,115
52,344
14.2
15.3
30.0
31.1
15.4
14.9
1.9
1.8
-
-
1.2
1.2
ONGC
Neutral
182
-
232,923
83,111
84,934
44.2
44.9
16.4
16.9
11.1
10.7
1.3
1.2
-
-
2.7
2.6
Indian Oil Corp
Neutral
391
-
189,672
396,116
432,560
8.5
8.8
40.1
42.2
9.7
9.3
1.7
1.5
-
-
0.6
0.6
Reliance Industries
Neutral
943
-
613,276
257,711
267,438
17.0
18.2
89.1
89.5
10.6
10.5
1.0
0.9
-
-
2.0
2.0
Pharmaceuticals
Alembic Pharma
Buy
512
600
9,648
3,346
3,915
19.6
19.2
21.0
23.9
24.4
21.4
4.3
3.7
19.1
18.4
2.9
2.5
Alkem Laboratories Ltd
Accumulate
1,968
2,125
23,527
6,320
7,341
17.5
19.8
72.7
96.6
27.1
20.4
4.8
4.0
16.7
18.7
3.7
3.1
Aurobindo Pharma
Buy
707
823
41,425
17,086
19,478
22.1
22.0
44.7
51.4
15.8
13.8
3.5
2.8
24.7
22.7
2.5
2.2
Aventis*
Neutral
4,391
-
10,113
2,411
2,698
18.8
18.8
151.6
163.9
29.0
26.8
4.5
3.6
25.4
27.5
3.8
3.2
Cadila Healthcare
Reduce
441
411
45,183
11,365
12,926
20.0
20.0
18.4
20.5
24.0
21.5
5.3
4.4
24.3
22.2
4.1
3.5
Cipla
Sell
611
462
49,134
16,163
18,711
16.6
16.9
20.7
24.3
29.5
25.1
3.5
3.1
12.6
13.1
3.2
2.7
Dr Reddy's
Reduce
2,288
2,040
37,944
13,734
15,548
17.7
20.2
69.9
102.0
32.7
22.4
2.9
2.7
9.2
12.4
3.0
2.6
GSK Pharma*
Sell
2,466
2,000
20,892
2,968
3,324
13.8
15.9
37.8
46.3
65.3
53.3
11.4
12.5
16.7
22.4
6.8
6.3
Indoco Remedies
Sell
288
136
2,652
1,114
1,297
9.9
13.9
5.6
11.4
51.4
25.2
3.9
3.5
7.7
14.5
2.7
2.2
Stock Watch
November 29, 2017
Company Name
Reco
CMP
Target
Mkt Cap
Sales ( Čcr )
OPM(%)
EPS (Č)
PER(x)
P/BV(x)
RoE(%)
EV/Sales(x)
(Č)
Price ( Č)
( Č cr )
FY18E FY19E
FY18E
FY19E
FY18E
FY19E
FY18E
FY19E
FY18E
FY19E
FY18E
FY19E
FY18E
FY19E
Pharmaceuticals
Ipca labs
Accumulate
542
570
6,832
3,256
3,647
14.1
17.1
16.2
25.4
33.4
21.3
2.6
2.3
8.0
11.5
2.2
1.9
Lupin
Buy
833
1,091
37,635
16,240
18,562
21.3
21.7
42.5
49.6
19.6
16.8
2.5
2.2
13.3
13.7
2.4
2.0
Natco Pharma
Accumulate
926
1,057
16,160
1,886
2,016
32.3
29.5
23.2
22.0
40.0
42.0
8.4
7.4
20.9
17.6
8.4
7.9
Sun Pharma
Accumulate
544
615
130,447
28,312
31,826
20.7
22.4
18.5
22.3
29.4
24.4
3.3
3.0
11.5
14.0
4.2
3.7
Syngene International
Neutral
538
-
10,750
1,394
1,818
33.0
36.0
15.8
20.6
34.0
26.1
6.3
5.2
18.6
20.0
7.7
5.9
Power
Tata Power
Neutral
96
-
25,925
32,547
33,806
20.5
20.5
4.7
5.4
20.4
17.9
1.9
1.7
10.5
10.5
1.8
1.7
NTPC
Neutral
183
-
150,521
86,070
101,246
28.3
30.7
12.9
16.2
14.2
11.3
1.5
1.4
10.6
12.4
3.1
2.8
Power Grid
Accumulate
208
223
108,896
29,183
32,946
89.7
90.0
18.0
20.8
11.6
10.0
1.9
1.7
17.7
18.2
7.7
7.1
Real Estate
Prestige Estate
Neutral
314
-
11,756
4,607
5,146
21.0
22.2
7.9
9.8
39.7
32.0
2.4
2.3
10.3
12.0
3.7
3.4
MLIFE
Accumulate
473
522
2,429
487
590
12.3
17.8
21.0
31.2
22.5
15.2
1.2
1.1
5.2
7.4
3.7
3.0
Telecom
Bharti Airtel
Neutral
492
-
196,752
97,903
105,233
36.0
36.3
9.3
11.1
52.9
44.5
2.6
2.4
5.0
5.6
3.0
2.7
Idea Cellular
Neutral
95
-
34,323
35,012
37,689
27.1
27.7
(4.4)
(2.7)
1.5
1.5
(6.8)
(4.6)
2.3
2.1
zOthers
Abbott India
Neutral
5,044
-
10,718
3,244
3,723
14.9
16.1
167.5
209.4
30.1
24.1
6.6
5.6
23.7
24.8
3.0
2.5
Asian Granito
Accumulate
504
570
1,515
1,169
1,286
12.5
12.5
16.0
19.7
31.5
25.6
3.4
3.0
10.7
11.6
1.5
1.4
Bajaj Electricals
Neutral
494
-
5,024
4,646
5,301
6.7
7.6
16.1
22.3
30.7
22.2
5.0
4.3
16.4
19.2
1.1
0.9
Banco Products (India)
Neutral
248
-
1,772
1,530
1,695
13.2
12.7
19.0
20.0
13.0
12.4
2.1
1.8
0.2
0.2
1.1
119.3
Coffee Day Enterprises
Neutral
240
-
4,945
3,494
3,913
17.4
18.0
4.8
5.7
-
42.1
2.1
2.0
-
0.1
1.9
1.6
Ltd
Elecon Engineering
Neutral
78
-
873
171
201
15.0
16.2
36.0
43.0
2.2
1.8
0.2
0.2
0.1
0.1
4.5
3.8
Garware Wall Ropes
Neutral
919
-
2,012
928
1,003
15.2
15.2
39.4
43.2
23.3
21.3
3.9
3.3
16.5
15.4
2.0
1.8
Goodyear India*
Neutral
877
-
2,023
1,717
1,866
11.8
12.3
47.9
49.8
18.3
17.6
2.8
2.5
15.6
15.7
0.9
125.2
Hitachi
Neutral
2,580
-
7,016
2,355
2,715
10.3
10.8
49.0
60.9
52.7
42.4
12.3
9.7
0.2
0.2
3.0
2.6
HSIL
Neutral
514
-
3,717
2,240
2,670
14.6
15.0
17.0
22.0
30.3
23.4
2.5
2.4
0.1
0.1
1.9
1.5
Interglobe Aviation
Neutral
1,163
-
44,688
22,570
27,955
14.2
15.0
63.6
81.8
18.3
14.2
9.6
8.1
0.5
0.6
1.7
1.3
Jyothy Laboratories
Neutral
391
-
7,111
1,781
2,044
14.1
15.0
9.4
10.5
41.8
37.3
8.9
8.4
0.2
0.2
4.2
3.6
Linc Pen & Plastics
Neutral
283
-
418
420
462
9.3
9.3
15.3
17.1
18.5
16.5
3.1
3.2
16.9
19.5
1.0
1.0
M M Forgings
Neutral
872
-
1,053
542
642
20.1
21.0
41.6
56.8
21.0
15.4
2.9
2.4
0.1
0.2
2.4
2.1
Mirza International
Neutral
162
-
1,951
1,148
1,285
18.0
18.0
8.0
9.4
20.2
17.3
3.3
2.8
16.3
16.1
1.9
1.6
Navkar Corporation
Buy
185
265
2,788
561
617
41.5
41.5
11.5
12.7
16.1
14.6
1.7
1.5
10.5
10.4
5.6
4.9
Nilkamal
Neutral
1,807
-
2,697
2,317
2,525
11.4
11.1
96.0
105.0
18.8
17.2
3.2
2.8
0.2
0.2
1.1
1.0
Stock Watch
November 29, 2017
Company Name
Reco
CMP
Target Mkt Cap
Sales ( Čcr )
OPM(%)
EPS (Č)
PER(x)
P/BV(x)
RoE(%)
EV/Sales(x)
(Č)
Price ( Č)
( Č cr )
FY18E FY19E FY18E FY19E FY18E FY19E FY18E FY19E FY18E FY19E FY18E FY19E FY18E FY19E
zOthers
Parag Milk Foods
Neutral
237
-
1,992
1,987
2,379
7.6
9.0
12.4
18.3
19.1
12.9
2.7
2.4
8.2
13.2
1.1
1.0
Radico Khaitan
Neutral
285
-
3,796
1,811
1,992
13.2
13.2
8.1
8.8
35.2
32.4
3.6
3.9
10.1
12.0
2.4
2.2
Relaxo Footwears
Neutral
636
-
7,651
1,981
2,310
13.7
14.5
12.0
15.5
53.0
41.0
10.3
8.3
0.2
0.2
3.9
3.4
Siyaram Silk Mills
Accumulate
642
680
3,010
1,769
1,981
12.7
12.7
22.6
26.2
28.4
24.5
4.4
3.8
15.5
15.5
1.9
1.7
Styrolution ABS India* Neutral
1,038
-
1,826
1,800
1,980
8.0
8.1
42.0
46.2
24.7
22.5
2.8
2.5
0.1
0.1
1.1
1.0
Surya Roshni
Neutral
390
-
1,710
4,870
5,320
7.7
7.8
22.8
28.1
17.2
13.9
2.3
2.0
0.1
0.1
0.6
0.5
TVS Srichakra
Neutral
3,492
-
2,674
2,729
2,893
12.7
12.5
248.5
265.0
14.1
13.2
4.0
3.2
0.3
0.3
1.0
0.9
Visaka Industries
Neutral
630
-
1,000
1,104
1,214
12.1
12.6
31.0
37.9
20.3
16.6
2.5
2.2
0.1
0.1
1.1
1.0
VIP Industries
Accumulate
372
400
5,262
1,450
1,693
10.4
10.5
6.5
7.8
56.9
47.7
12.0
10.5
21.1
22.1
3.6
3.1
Navin Fluorine
Accumulate
684
730
3,373
945
1,154
22.4
22.6
28.7
34.8
23.8
19.7
3.9
3.4
-
-
3.1
2.4
Source: Company, Angel Research; Note: *December year end; #September year end; &October year end; Price as on November 28, 2017
Market Outlook
November 29, 2017
Research Team Tel: 022 - 39357800
DISCLAIMER
Angel Broking Private Limited (hereinafter referred to as “Angel”) is a registered Member of National Stock Exchange of India
Limited,Bombay Stock Exchange Limited and Metropolitan Stock Exchange Limited. It is also registered as a Depository Participant with
CDSL and Portfolio Manager with SEBI. It also has registration with AMFI as a Mutual Fund Distributor. Angel Broking Private Limited is a
registered entity with SEBI for Research Analyst in terms of SEBI (Research Analyst) Regulations, 2014 vide registration number
INH000000164. Angel or its associates has not been debarred/ suspended by SEBI or any other regulatory authority for accessing
/dealing in securities Market. Angel or its associates/analyst has not received any compensation / managed or
co-managed public offering of securities of the company covered by Analyst during the past twelve months.
This document is solely for the personal information of the recipient, and must not be singularly used as the basis of any investment
decision. Nothing in this document should be construed as investment or financial advice. Each recipient of this document should make
such investigations as they deem necessary to arrive at an independent evaluation of an investment in the securities of the companies
referred to in this document (including the merits and risks involved), and should consult their own advisors to determine the merits and
risks of such an investment.
Reports based on technical and derivative analysis center on studying charts of a stock's price movement, outstanding positions and
trading volume, as opposed to focusing on a company's fundamentals and, as such, may not match with a report on a company's
fundamentals. Investors are advised to refer the Fundamental and Technical Research Reports available on our website to evaluate the
contrary view, if any.
The information in this document has been printed on the basis of publicly available information, internal data and other reliable
sources believed to be true, but we do not represent that it is accurate or complete and it should not be relied on as such, as this
document is for general guidance only. Angel Broking Pvt. Limited or any of its affiliates/ group companies shall not be in any way
responsible for any loss or damage that may arise to any person from any inadvertent error in the information contained in this report.
Angel Broking Pvt. Limited has not independently verified all the information contained within this document. Accordingly, we cannot
testify, nor make any representation or warranty, express or implied, to the accuracy, contents or data contained within this document.
While Angel Broking Pvt. Limited endeavors to update on a reasonable basis the information discussed in this material, there may be
regulatory, compliance, or other reasons that prevent us from doing so.
This document is being supplied to you solely for your information, and its contents, information or data may not be reproduced,
redistributed or passed on, directly or indirectly.
Neither Angel Broking Pvt. Limited, nor its directors, employees or affiliates shall be liable for any loss or damage that may arise from
or in connection with the use of this information.